Understand the features
Every line, label and panel on your chart explained — the channel, the moving averages, the label glossary and the settings worth knowing.
All steps
This is your reference manual for the chart. Once the Navigator is attached, the screen fills with lines, labels and panels. This page explains what each one means. When you’re ready to put them to work, move on to the core skills.
What you see on the chart
With the Navigator attached, your chart shows:
- The current channel — a sloped price channel made of a resistance line on top, a support line at the bottom, and a middle line halfway between them.
- The previous channel — the channel that was in force before the latest one formed, shown faded. Handy for reference once a new channel starts.
- Extended lines — an extended resistance line above the channel and an extended support line below it. These mark the next levels if price overshoots the channel.
- The MA 5 — one moving average, the orange line, that follows the last five bars. It is on by default and can be hidden in the settings.
- Two information panels — Trend Analysis at the top and Channel Levels at the bottom. The Channel Levels panel starts hidden, and both can be toggled in the settings.
- Labels — letters printed on the bars as things happen: support and resistance hits, buy and sell signals, breakouts, and markers showing where a new channel began.
The channel lines
- Resistance — the top of the channel. When price reaches it, price is expected to fall.
- Support — the bottom of the channel. When price reaches it, price is expected to rise.
- Middle — halfway between support and resistance. This is the first take-profit reference in the core skills.
- Extended resistance — the next resistance above the channel, used when price overshoots the top.
- Extended support — the next support below the channel, used when price overshoots the bottom.
The green “good channel”
When the channel is drawn in green, the Navigator is telling you it’s a good channel — one that’s capturing the trend well. Think of it as a quick confidence check: green means the channel is reliable right now. Judging a channel properly is the first core skill, covered in the next stage.
The labels, one by one
Labels print on the bars as events happen, and they’re all colour-coded by family, so you can tell at a glance which side each one belongs to.
No need to memorise the table. Hover your mouse over any label on the chart and TradingView shows its full name and the price it printed at.
See the labels on a chart
Pick a label group to see how it prints on a chart, and what triggers it. The hits (resistance and support) just mark price reaching a level; the buy and sell signals are the entry cues that follow. Each signal card lists the steps the Navigator checks before it prints the label, and the B1 to B3 tags on its chart mark the three confirmation bars (bar 1, 2 and 3).
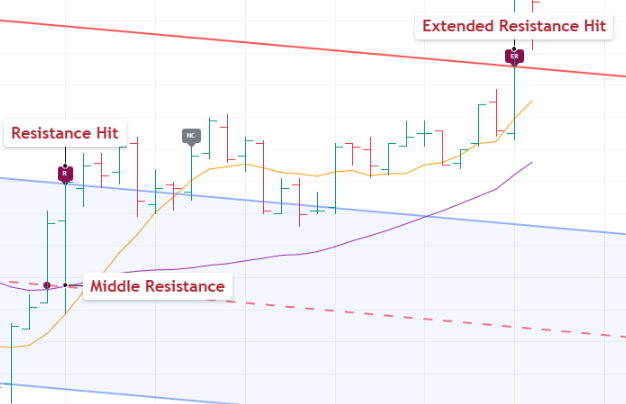
Two labels mark the resistance side: R prints when price reaches the resistance line, ER when it reaches the extended resistance line above it. A maroon dot marks middle resistance on the middle line. A hit only marks price reaching a level — it's not an entry.
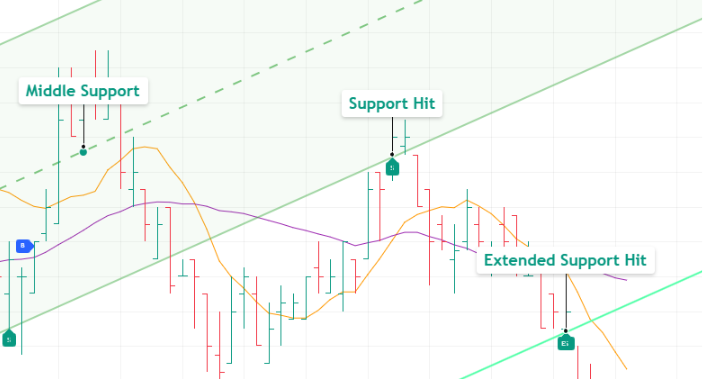
Two labels mark the support side: S prints when price reaches the support line, ES when it reaches the extended support line below it. A green dot marks middle support on the middle line. Like the resistance hits, these are not entries on their own.
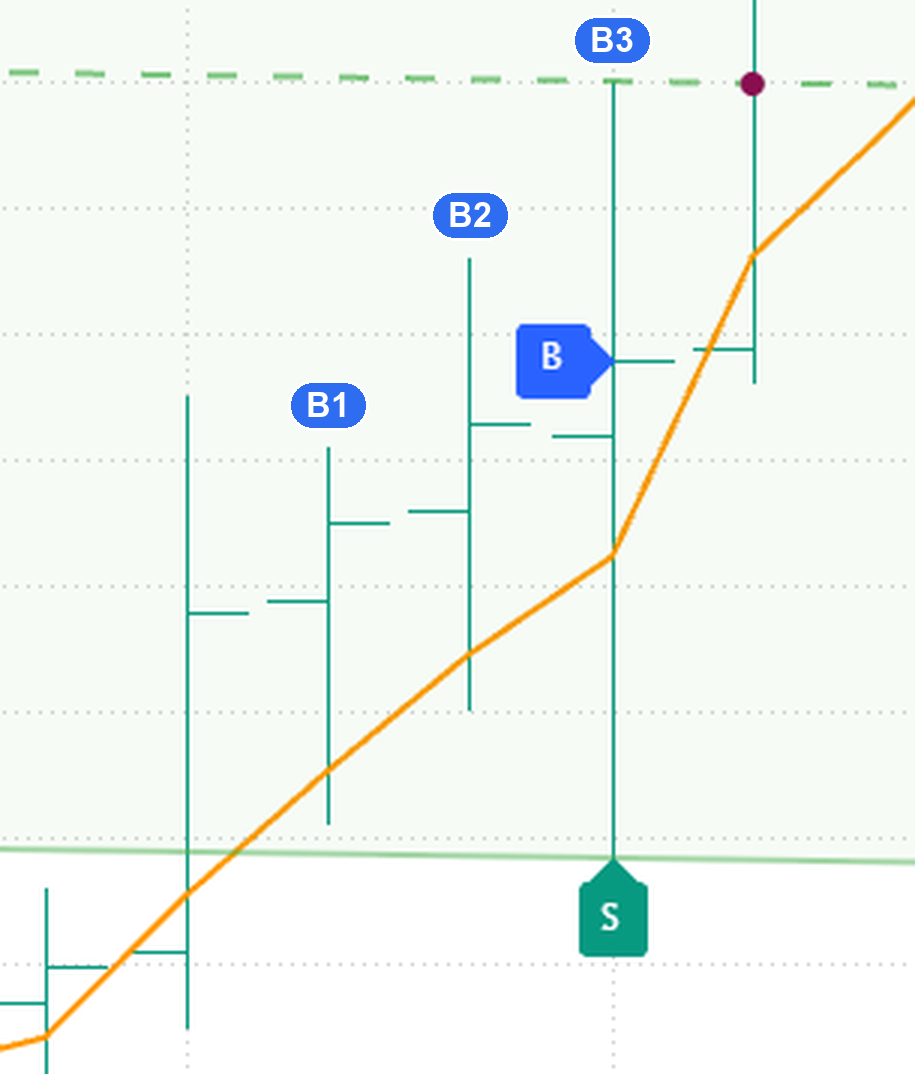
- Price hits support (the S label).
- Three bars in a row (B1, B2, B3) close above the orange MA 5. B2 and B3 also close above support; B1 may close below it.
- One of them pushes past the bar before it: B2 closes above B1's high, or B3 above B2's high.
- On B3 the MA 5 is sloping up.
- B prints on B3 at its close. That close is the entry.
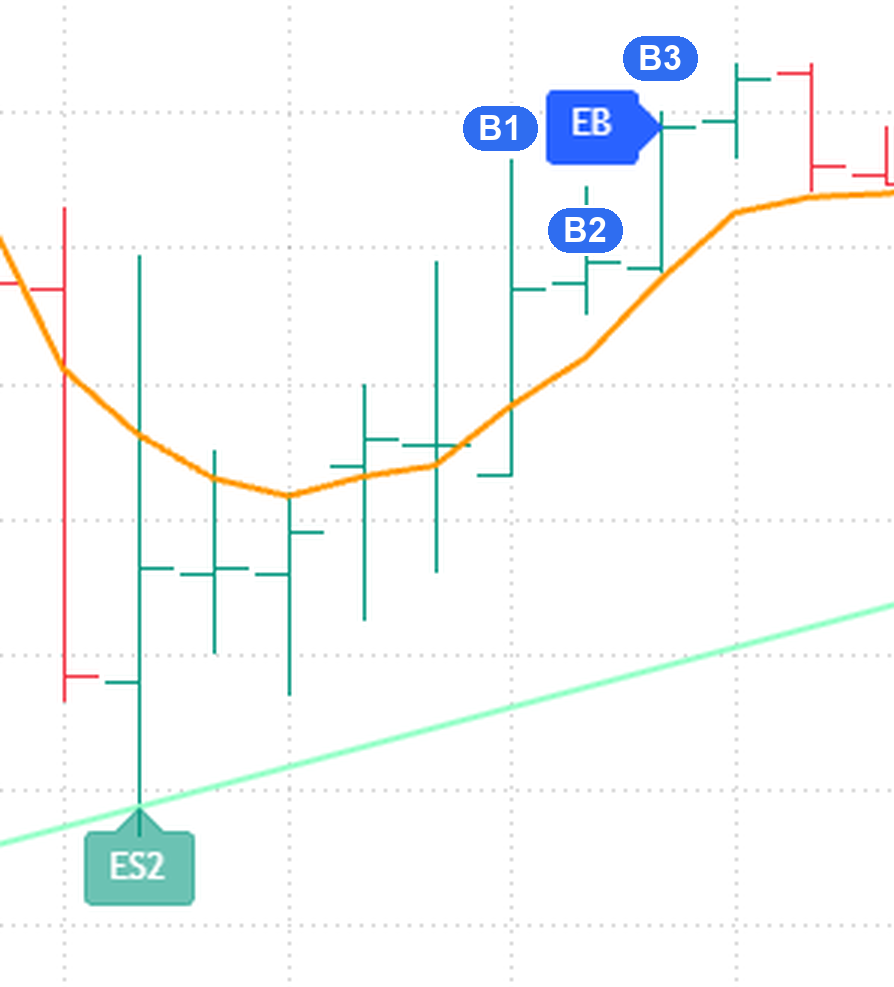
- Price hits the extended support line for the second time (the ES2 label).
- Three bars in a row (B1, B2, B3) close above the orange MA 5. B2 and B3 also close above extended support.
- One of them pushes past the bar before it: B2 closes above B1's high, or B3 above B2's high.
- On B3 the MA 5 is sloping up.
- EB prints on B3 at its close, unless that close is too close to the support line.
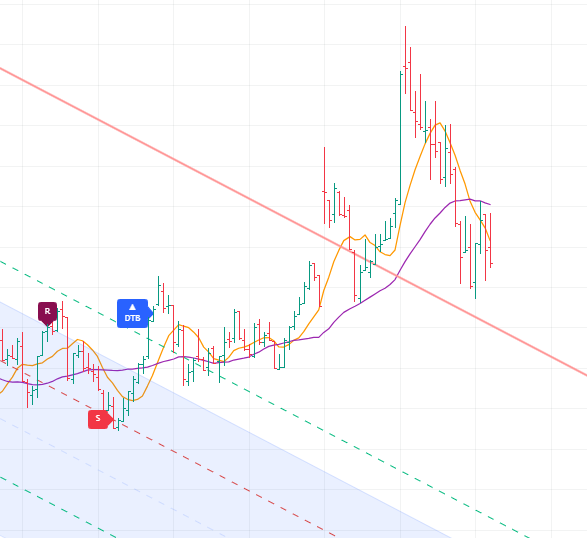
A different trigger — price breaks out above a downtrend. It follows through about half the time, so keep the losses small and let the winners run.
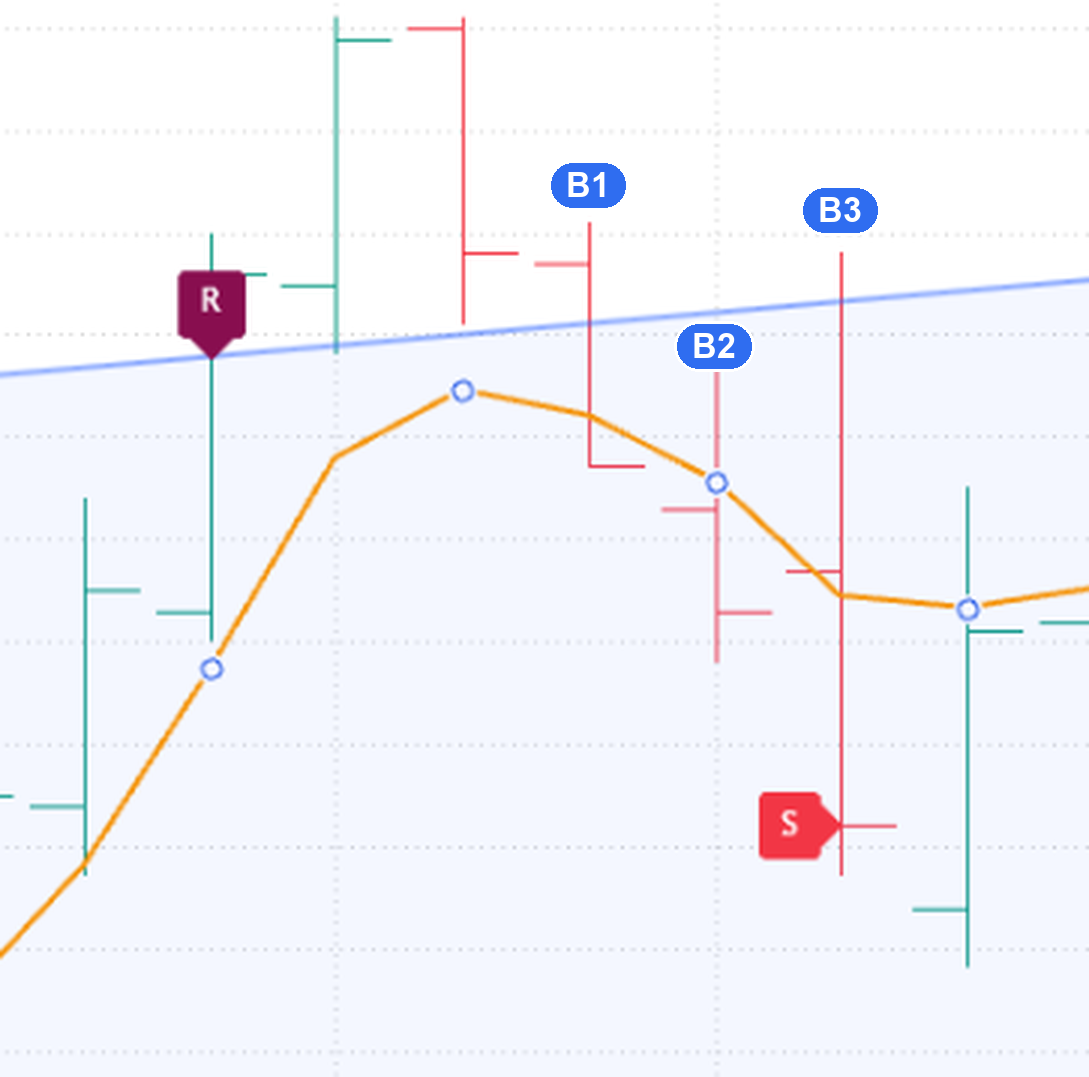
- Price hits resistance (the R label).
- Three bars in a row (B1, B2, B3) close below the orange MA 5. B2 and B3 also close below resistance; B1 may close above it.
- One of them pushes past the bar before it: B2 closes below B1's low, or B3 below B2's low.
- On B3 the MA 5 is sloping down.
- S prints on B3 at its close. That close is the entry.
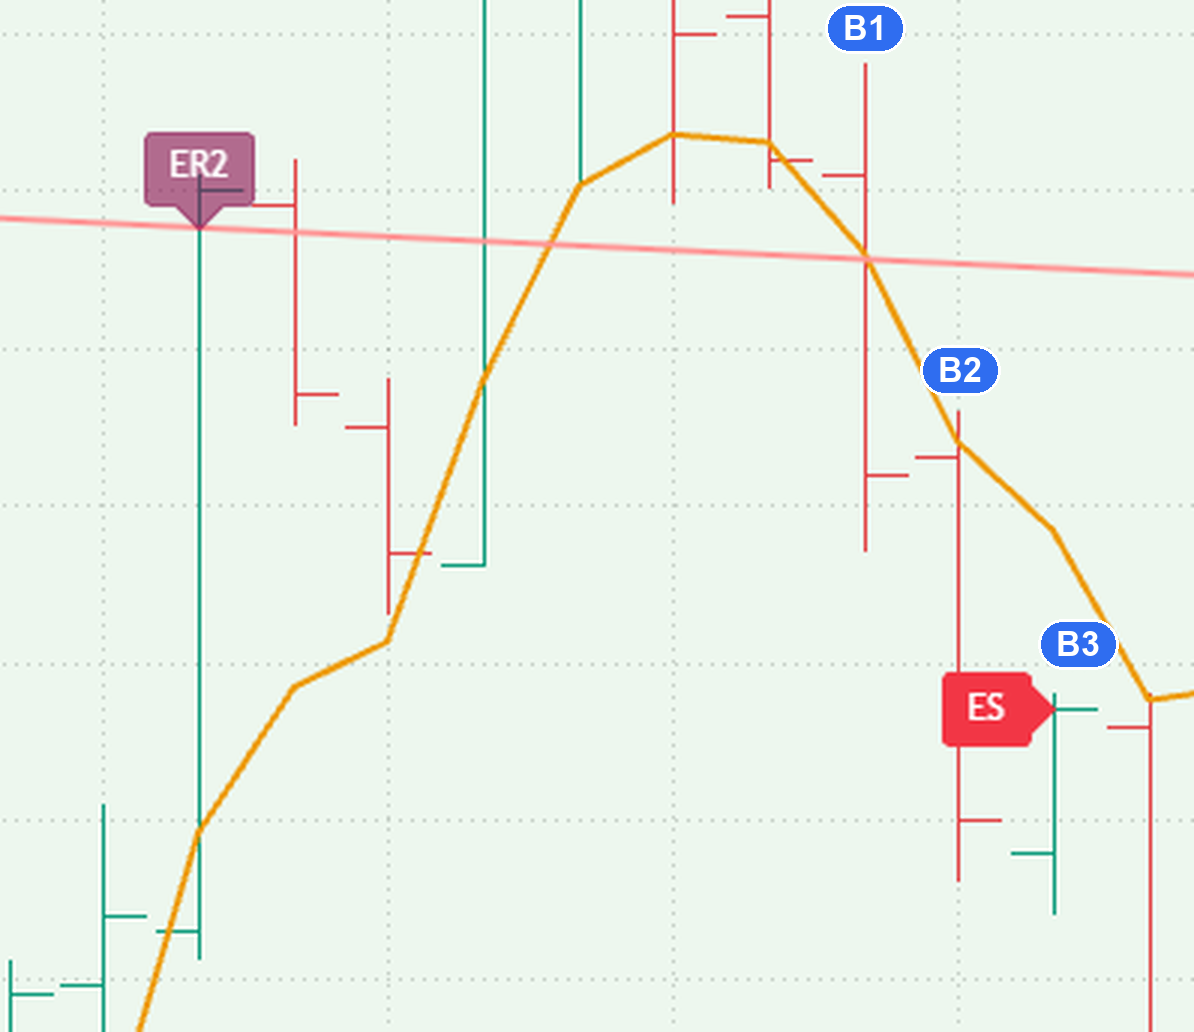
- Price hits the extended resistance line for the second time (the ER2 label).
- Three bars in a row (B1, B2, B3) close below the orange MA 5. B2 and B3 also close below extended resistance.
- One of them pushes past the bar before it: B2 closes below B1's low, or B3 below B2's low.
- On B3 the MA 5 is sloping down.
- ES prints on B3 at its close, unless that close is too close to the resistance line.
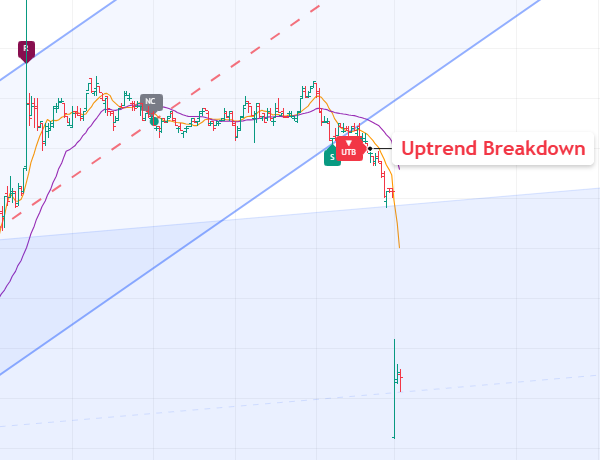
A different trigger — price breaks down below an uptrend. It follows through about half the time.
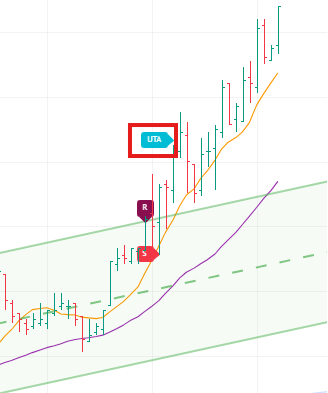
Marks the uptrend picking up speed. It's not an entry on its own — it tells you the up move is getting stronger.
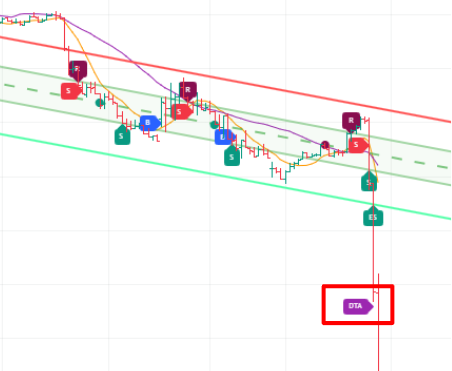
Marks the downtrend picking up speed — the down move is getting stronger.
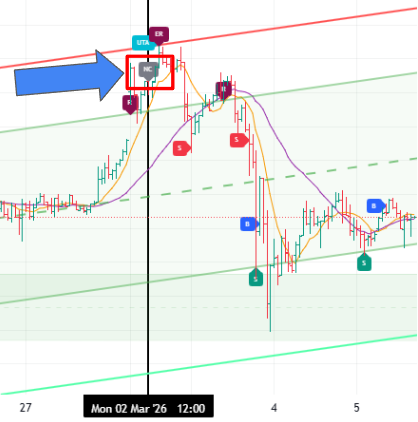
NC marks the bar where the current channel formed. Before that bar, the previous channel was still in force. The section below shows how to look back at it.
Looking back at older channels
To see an older channel and the signals that fired on it, use TradingView’s Bar Replay tool in the top panel. Set the blue bar-selector to the bar just before the grey NC label, and the chart redraws the previous channel with all its labels.
The two panels
Trend Analysis panel
This panel tells you two things about the current channel:
- Trend direction — uptrend, sideways, or downtrend.
- Width — how wide the channel is compared with the market’s normal movement. It’s expressed as a multiple of the Average True Range, so you might see “Wide (12.1x ATR)”. The bigger the number, the wider the channel relative to how much price usually moves.
Channel Levels panel
This one lists the exact prices of the current channel’s levels on the latest bar: resistance (R), middle (M), support (S), extended resistance (ER) and extended support (ES). It starts hidden — turn it on under UI Panels in the settings when you want the numbers.
A practical use: if a new channel forms while you still hold an open position, the previous channel — still drawn faded on the chart — gives you your exit references.
Settings worth knowing
Hover over the indicator’s name at the top-left of the chart and click the gear icon.
The settings window groups everything into four sections. You don’t need every option — here’s what each section covers.
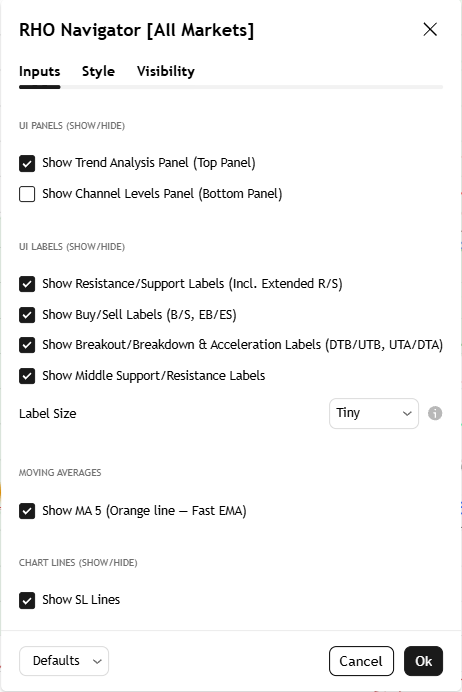
UI Panels
Show or hide the two info panels, Trend Analysis at the top and Channel Levels at the bottom. Handy on the phone.
UI Labels
Show or hide each label family: the support and resistance hits, the buy and sell signals, the breakout and acceleration labels, and the middle-line dots. Label Size picks how big they print.
Moving Averages
Show or hide the MA 5, the orange line.
Chart Lines
One toggle, Show SL Lines: the stop-loss lines beyond the channel and the extended lines. Off by default.
The SL lines
One toggle under Chart Lines, Show SL Lines, draws an SL (stop-loss) line beyond each side of the channel and beyond each extended line: four lines in all.
It is off by default, and we recommend leaving it off until you need it — with every line showing, the chart crowds up fast.
One term before the cards: a bar’s height is the distance from its lowest point to its highest. When a new channel forms, the Navigator measures the height of a typical bar at that moment and places each SL line 1.5 bar heights beyond the level it protects.
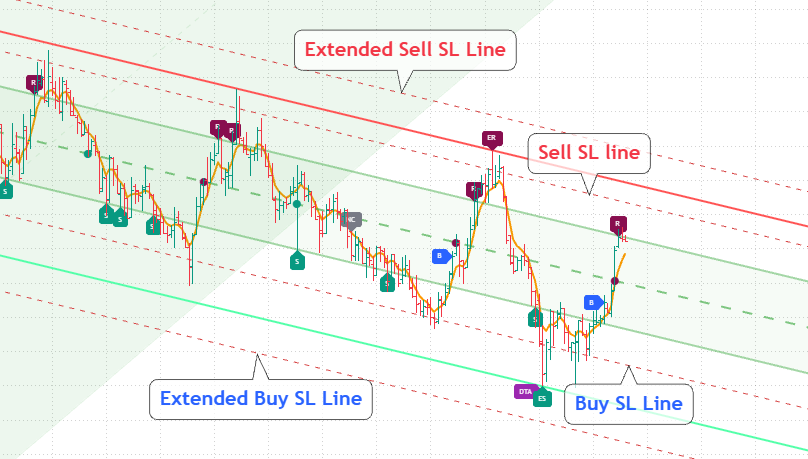
- Buy Buy SL line: 1.5 bar heights below support — the stop for a B.
- Sell Sell SL line: 1.5 bar heights above resistance — the stop for an S.
- Ext Extended Buy and Extended Sell SL lines: the same distance beyond the extended lines — the stops for an EB or an ES.
Stuck anywhere? Message us on Telegram and we'll walk you through it.