Always a trend.
Now you'll see it.
A TradingView indicator that reads support, resistance and trend for you — and a private Telegram group that sends the buy and sell signals straight to your phone.
✓ Comes with 3 months of free TradingView, worth up to $297 SGD
✓ Over 170 active subscribers
See it work in real time
Support, resistance and trend — redrawn the moment price moves.
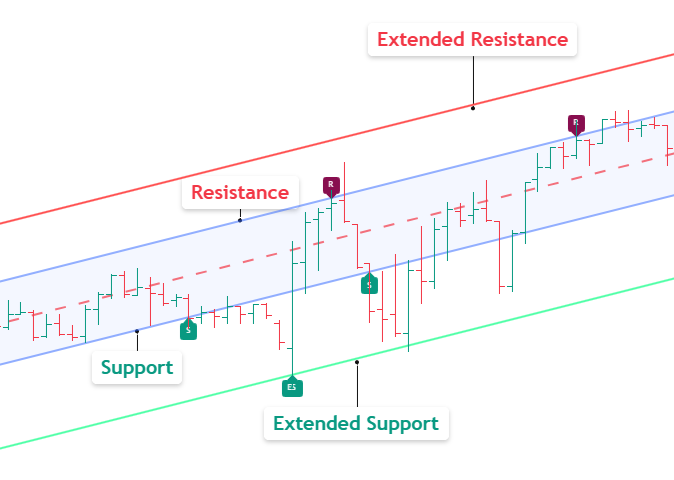
Where the market tends to turn
The Navigator draws the trend channel the market is moving in, then marks the support and resistance for you. Support is the floor price keeps bouncing off. Resistance is the ceiling it keeps stalling under.
- Price usually bounces back up off support.
- And drifts back down from resistance.
- If a move overshoots, the extended lines further out tend to catch it.
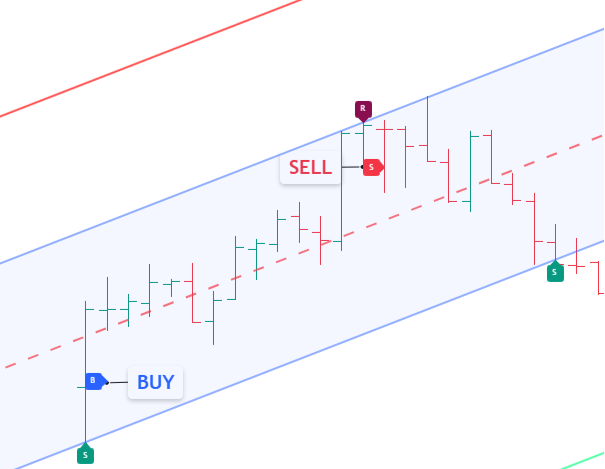
When to get in and out
Once price bounces up off support, the Navigator prints a buy on the chart. When price turns back down from resistance, it prints a sell. You don't have to catch the turn yourself; the signal shows up for you.
- A buy appears after price bounces up off support.
- A sell appears after price turns down from resistance.
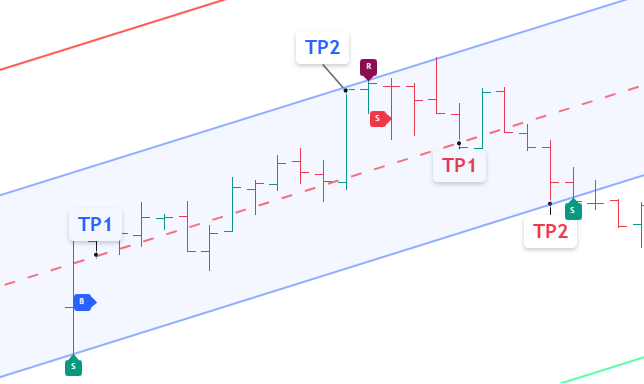
Where to take your profit
Every signal comes with two profit targets, set for you. The colours match the trade: blue targets belong to a buy, red targets to a sell.
- First target (TP1): the middle line of the channel.
- Second target (TP2): the resistance for a buy, or the support for a sell.
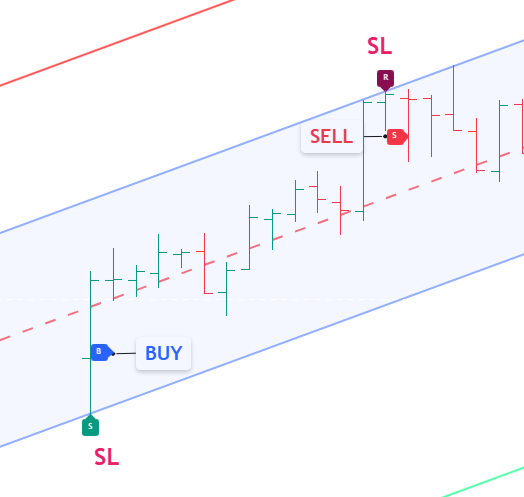
Where to get out if you're wrong
Every trade also gets a stop-loss, so you know your exit before you're in. It sits about one candle's height beyond the channel: below support for a buy, above resistance for a sell.
- Buy: about one candle's height below the support.
- Sell: about one candle's height above the resistance.
What you get as a subscriber
The indicator is half of it. Here's the rest.
Signals straight to your phone
Alerts on around 10 of the most traded names in each of your markets. The moment the Navigator prints a buy or sell, the signal lands in your private Telegram group — entry, take-profit and stop-loss worked out for you.
Robin's own trades
Robin trades the Navigator himself, and posts those trades to the same group. You see how 25 years of experience reads the same chart you're looking at.
A live webinar every week
Robin goes through the markets live on Zoom and points out setups as they appear. Can't make it? Every session is recorded.
Choose your markets
Single markets, combos, or everything. Billed quarterly, cancel anytime.
- ✓ All SG stocks, futures & indices
- ✓ Private SG signal group
- ✓ ~10 large-cap signals
- ✓ All US stocks, futures & indices
- ✓ Bonus: DAX 40 & Nikkei 225
- ✓ Private US signal group
- ✓ All HK stocks, futures & indices
- ✓ Private HK signal group
- ✓ ~10 large-cap signals
- ✓ All forex pairs
- ✓ All major cryptocurrencies
- ✓ Gold & Silver
- ✓ US: all stocks, futures & indices + DAX 40 & Nikkei 225
- ✓ HK: all stocks, futures & indices
- ✓ Singapore market FREE
- ✓ 3 private signal groups (~30 signals)
- ✓ US: all stocks, futures & indices + DAX 40 & Nikkei 225
- ✓ FXMC: all forex, crypto + Gold/Silver
- ✓ Singapore market FREE
- ✓ 3 private signal groups (~30 signals)
- ✓ HK: all stocks, futures & indices
- ✓ FXMC: all forex, crypto + Gold/Silver
- ✓ Singapore market FREE
- ✓ 3 private signal groups (~30 signals)
- ✓ US, HK, SG — all stocks, futures & indices
- ✓ Forex, crypto & all metals
- ✓ Unlimited — works on any instrument on TradingView
- ✓ All 4 private signal groups
Unlock the Pepperstone Price
This price is for clients who've opened a Pepperstone account through our link. That's the only requirement.
Funding the account and placing a trade aren't needed for this price — those unlock the separate free TradingView plan.
Want the Lower Price?
Open a Pepperstone account through our link and this plan costs $30 SGD less every quarter — plus you get 3 months of TradingView free.
Opening the account is the only requirement for the lower price — no deposit or trade needed. Those come later, for the free TradingView plan. The button opens our step-by-step guide in a new tab.
Our step-by-step guide is open in a new tab — it walks you through opening your account, about 10 minutes. When you're done, come back to this tab and continue at your lower price.
The Pepperstone price needs only a Pepperstone account opened under our link. How it works →
Your subscription, effectively free
The Navigator runs on TradingView. Open your Pepperstone account through us and you get 3 months of a paid TradingView plan free — worth up to $297 SGD, renewable free after that. That's more than most Navigator plans cost.
How to get it freeCommon questions
How does the Navigator work?
It draws three lines on your chart — a ceiling (resistance), a floor (support) and a middle line — and updates them as the market moves. It also shows you the trend direction and prints buy and sell labels with suggested take-profit and stop-loss levels.
Do I need to be experienced to use it?
No. The Navigator shows you the key levels and signals in plain terms, and our weekly webinars walk you through how to read and act on them. Plenty of our members were new to charts when they started.
Which markets and stocks does it cover?
Hong Kong, Singapore and US stocks, plus Forex, Crypto and Metals. Once you subscribe to a market, the indicator works on any stock or instrument in that market.
How do I get the free TradingView plan?
Open a Pepperstone account through our link, add funds and place one trade. Pepperstone then gives you a paid TradingView plan free. We're happy to walk you through the setup step by step.
Pepperstone isn't MAS-regulated — is my money safe?
Pepperstone answers to seven regulators, including Australia's ASIC and the UK's FCA, two of the strictest in the world. Client money sits in segregated accounts at Tier-1 banks such as Barclays, legally separate from the company's own funds, and EY audits that segregation every year. The full answers are on the Free TradingView page.
Can I cancel anytime?
Yes. You can cancel anytime from your account page. There are no long-term contracts — your access simply runs to the end of the quarter you've paid for.
Let's get you set up
Pick your markets and get the Navigator on your charts today.