Core skills of the Navigator
The three skills that make the Navigator work — judging a good channel, drawing your own lines, and entering and exiting off those lines.
All steps
This is the heart of trading the Navigator well. Three skills, and they build on each other: find a channel worth trading, draw the levels the Navigator leaves off, then use those lines to enter and exit. Get these three right and the rest (the signals, the setups) gets a lot easier.
Skill 1 — Pick the best channel
Nothing else works without this. The lines and the signals are only as good as the channel they’re drawn on, so the first job on any chart is to find a channel worth trading.
What a good channel looks like
A good channel is one where the lines are doing their job:
- Price bounces off the lines. It touches resistance and turns down, touches support and turns up, over and over.
- The middle line gets respected. Price pauses or turns at it on the way across the channel.
- Very few bars poke through. Price lives inside the channel instead of cutting through the lines.
- The channel is green. The Navigator draws the channel in green when it’s capturing the trend well. A quick first check, not the whole answer.
A bad channel is the opposite: price drifts straight through the lines without reacting, and the labels print where nothing happens. Any signal from a channel like that is unreliable. Don’t trade it — find a better one.
Try the timeframes that match how you trade
The Navigator draws a channel on every timeframe, but on any given market only some of them are worth trading. So step through the timeframes that suit your style, and keep the one where the lines behave best.
- Trading in and out within minutes? Try 1, 2, 3, 4 and 5 minutes.
- Holding for days or weeks? Try 30 minutes, 1 hour, 2, 3 and 4 hours.
On each timeframe, ask the same question: is price bouncing off the lines? If yes, you’ve found your channel. If not, switch to the next timeframe and look again. And if no timeframe gives you a clean channel, that’s an answer too — trade a different market, or come back later.
Compare them side by side
Here’s the same market on three timeframes. Flip through them the way you would on TradingView and judge each one against the checklist above.
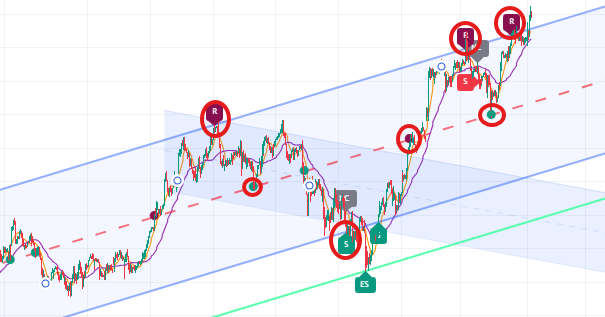
Price bounces at the middle line and at resistance, so the lines are doing their job. You could trade this channel.
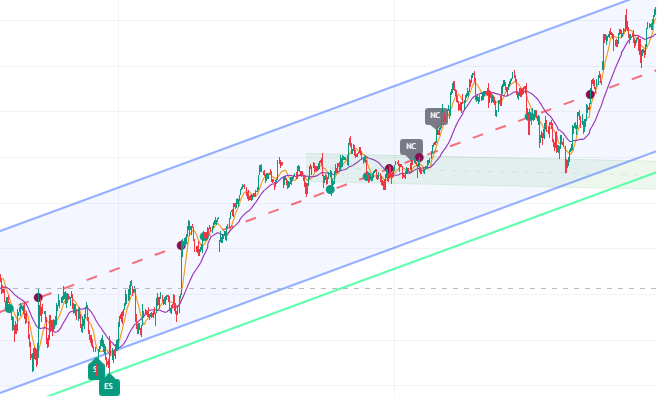
The turning points only connect with the middle line. Resistance and support barely touch price, so two of the three lines aren't telling you anything.
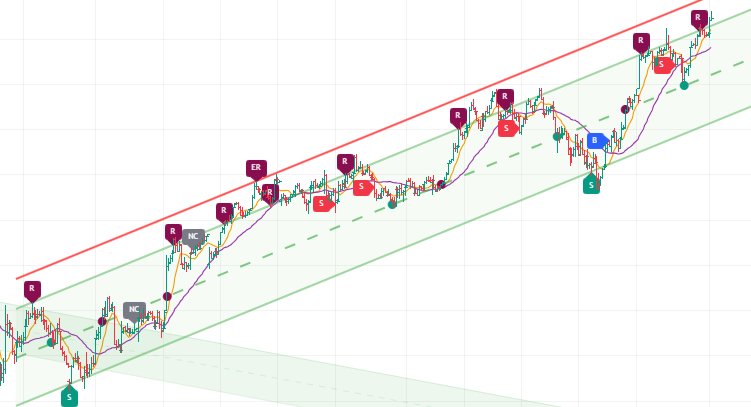
Every line acts as clean support or resistance across the whole channel. When one timeframe behaves this well, this is the chart to trade.
Skill 2 — Draw your own parallel lines
Once you trust the channel, its slope is reusable. Clone it into parallel lines and project them above or below, and you surface extra support and resistance levels the Navigator doesn’t plot — levels that help you enter and exit earlier. The Navigator could draw more lines itself, but it’s deliberately limited to keep the chart clean.
There are two scenarios where you should draw parallel lines.
When price overshoots the Navigator’s lines
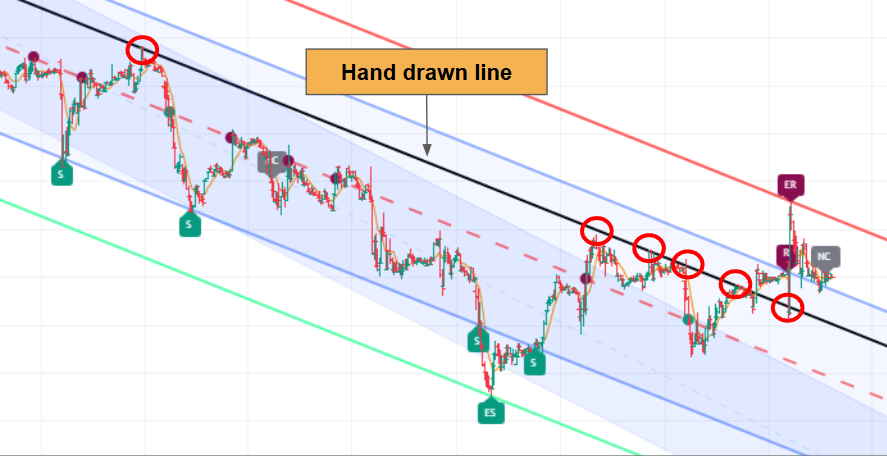
When price pushes past the channel, draw a parallel line at the overshoot to mark the new level to watch — price tends to respect it on the next visit.
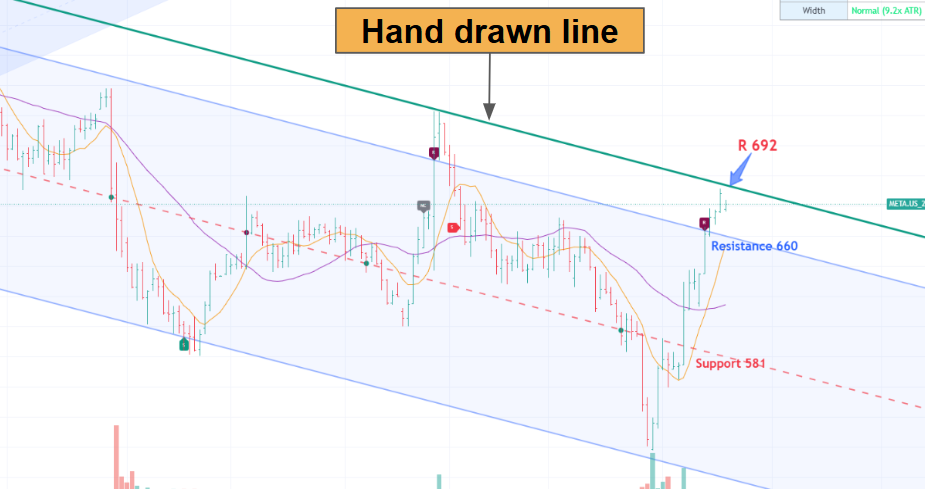
Price pushed past resistance at 660. The hand-drawn line above the channel marked the next level — price ran to it at 692 and stalled.
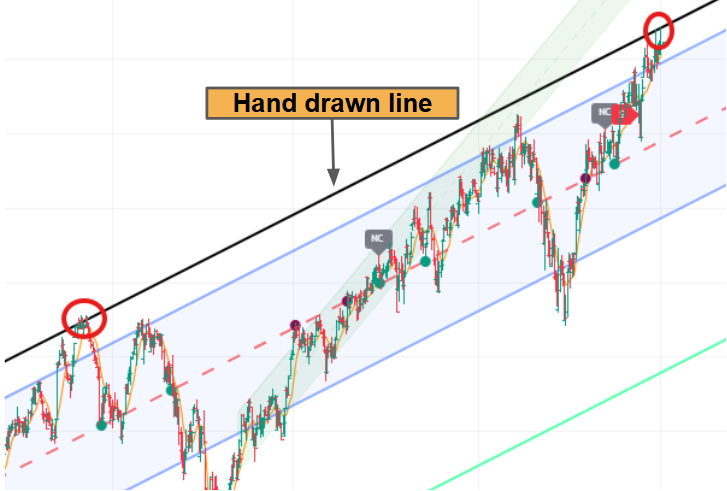
Price poked above the channel at the circled points. A parallel line through the first overshoot caught the later one too.
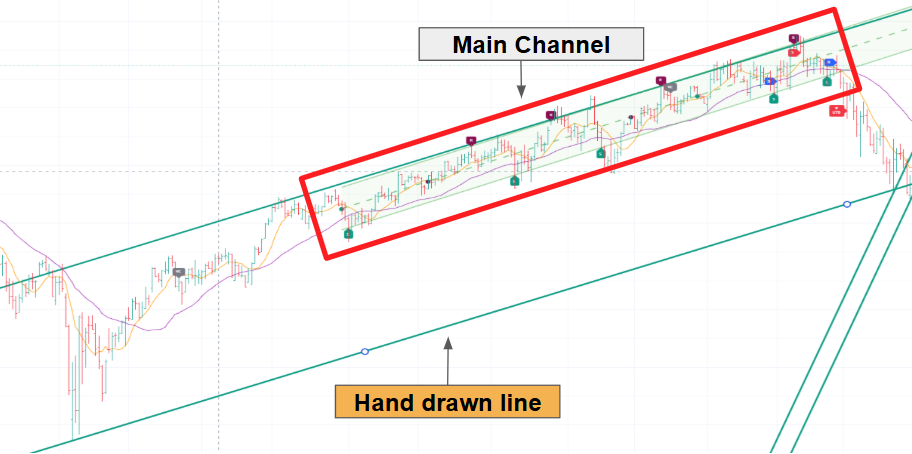
The main channel is boxed in red; the parallel line projected below it marked the support to watch when price eventually broke down out of the channel.
When the channel is wide
In a wide channel it’s unrealistic to expect price to run from the middle line all the way to support or resistance in one move. Parallel lines cloned inside the channel give you nearer, more realistic levels to trade against.
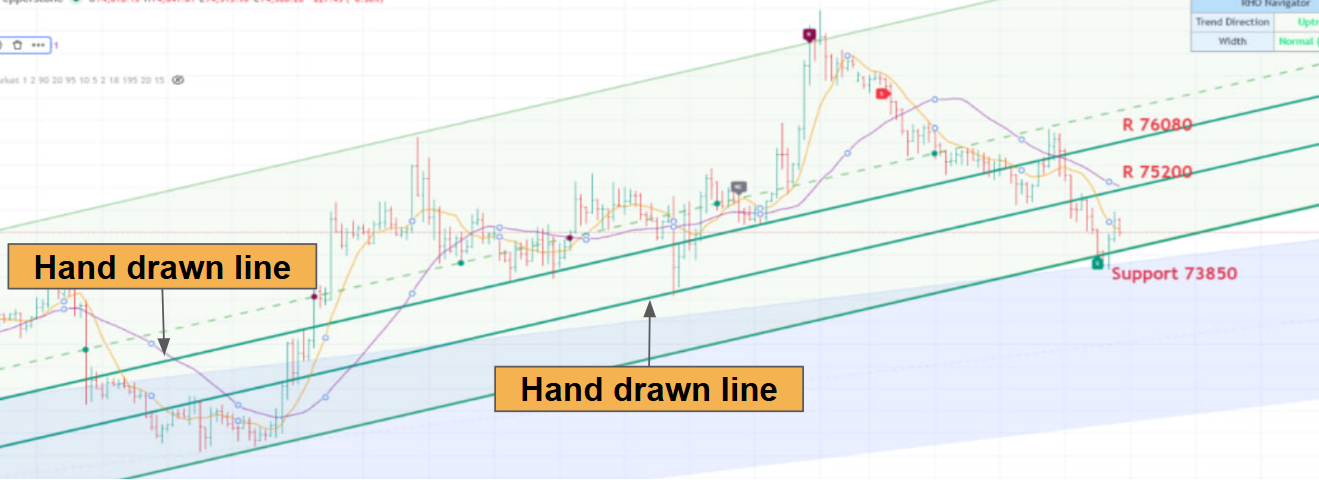
Two lines cloned inside the channel add levels at 75,200 and 76,080 between support and the top — nearer targets and turning points.
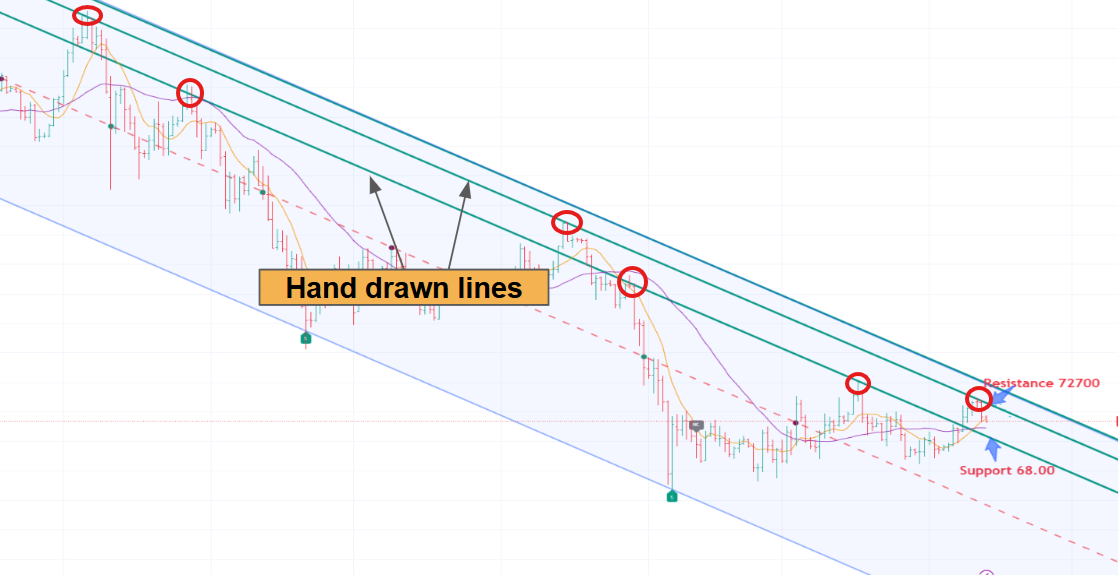
The inside lines kept acting as resistance on the way down — each circled touch an earlier exit or entry.
One line through the body of this wide channel, and price respected it again and again — first as support, then as resistance.
How to draw parallel trendlines in TradingView
Use TradingView’s trendline tool.
Start your line on the support or resistance line, then rotate it until it runs parallel.
Then right-click your new line and choose Clone, and move the copy until it connects with other turning points on the chart.
A valid line should touch at least 2 to 3 turning points — the more it connects, the stronger it is as support or resistance.
Skill 3 — Enter and exit off the lines
On a good channel with your lines drawn, the lines do the work. They tell you where to get in, where to take profit, and where to put your stop.
Entry type 1 — at the channel lines
Step 1: wait for price to reach a line. A Navigator line (support or resistance), or one of your own parallel lines. No line touched, no trade.
Step 2: choose how you get in. Two ways, and it’s a trade-off between reward and safety.
Buy the moment price touches support; sell the moment it touches resistance.
- Upside: The best price, and the most room to your target.
- Downside: Nothing has confirmed the line will hold yet.
Let price rebound off support before you buy, or pull back off resistance before you sell.
- Upside: Confirmation that the line is holding.
- Downside: You give up a little of the move.
To time that rebound, work down this list and use the first method that’s available to you:
- A secondary-trendline break, if there’s a trend to break — the best option.
- Our signal label — the fallback.
The trendline break gets you in earlier than the signal label, which is why it comes first.
1. Secondary-trendline break
Inside the Navigator’s main channel there are usually smaller trends running their own course. Connect the swing points (the spots where price turned) with a best-fit line, and you’ve got a secondary trendline.
When price reaches the main channel’s support or resistance, watch that secondary trendline. Buy when price breaks out above a secondary downtrend line; sell when it breaks down below a secondary uptrend line. The break is your entry, earlier and at a better price than waiting for the label.
2. Our signal — the fallback
If there’s no secondary trendline to break, the Navigator’s own B or S signal is your cue. It prints at the close of the third bar in a row beyond the MA 5 after the line hit — the three-bar confirmation spelt out on the signal cards in Understand the features. It’s the later of the two entries, but it’s automatic and it needs no drawing. One caution: when the channel is narrow compared with the bar size, the move can be over before the third bar closes, so the trendline break matters even more there.
Entry type 2 — the trend break (DTB and UTB)
These entries don’t wait for a rebound at a line — they fire when price breaks out of a trend. DTB (downtrend breakout): price breaks up out of a downtrend, a buy cue. UTB (uptrend breakdown): price breaks down out of an uptrend, a sell cue. The Navigator prints both labels for you, so there’s nothing to time.
They follow through about half the time, so keep the losses small and let the winners run.
Take profit — two ways
Both entry types exit the same way — off the lines, or earlier with the MA 5.
1. Read it off the lines
Your take-profit targets are the lines themselves: the middle line first, then the far side of the channel, the extended lines, and any parallel lines you drew in skill 2. Every line is the next take-profit target. Scale out: close part of the position at the first line, then hold the rest to the next one. The closer a realistic line sits, the more sense it makes to bank profit there rather than hold out for the far side, especially in a wide channel.
2. The MA 5 TP — take profit earlier
Instead of waiting for the next line, you can let the MA 5 (the orange line) call the exit:
- Only if there’s profit. No profit yet, no MA 5 exit.
- Wait for the trigger bar — a bar that closes above the MA 5.
- Take profit the moment another bar closes above the trigger bar’s high.
That’s the sell version, as in the chart. For a buy, mirror it: the trigger bar closes below the MA 5, and you take profit when a bar closes below its low.
The stop loss — about 1.5 bars beyond the line
Put your stop about 1.5 bar heights beyond the line you entered against: above resistance for a sell, below support for a buy. There’s no fixed number of points or percentage — it’s sized to how tall the bars on your chart actually are, so a normal wobble doesn’t stop you out but a genuine break does.
You don’t need to measure it yourself. The Navigator already works it out and draws it as the dotted SL line, 1.5 bar heights beyond each side of the channel. Turn it on in the settings (see the SL lines) and place your stop on it.
The trend-break entries use the same rule, anchored to the nearest channel line: for a UTB sell, the stop goes 1.5 bars above the nearest support line above you; mirror it for a DTB buy.
Stuck anywhere? Message us on Telegram and we'll walk you through it.